

Credits to Maven Analytics
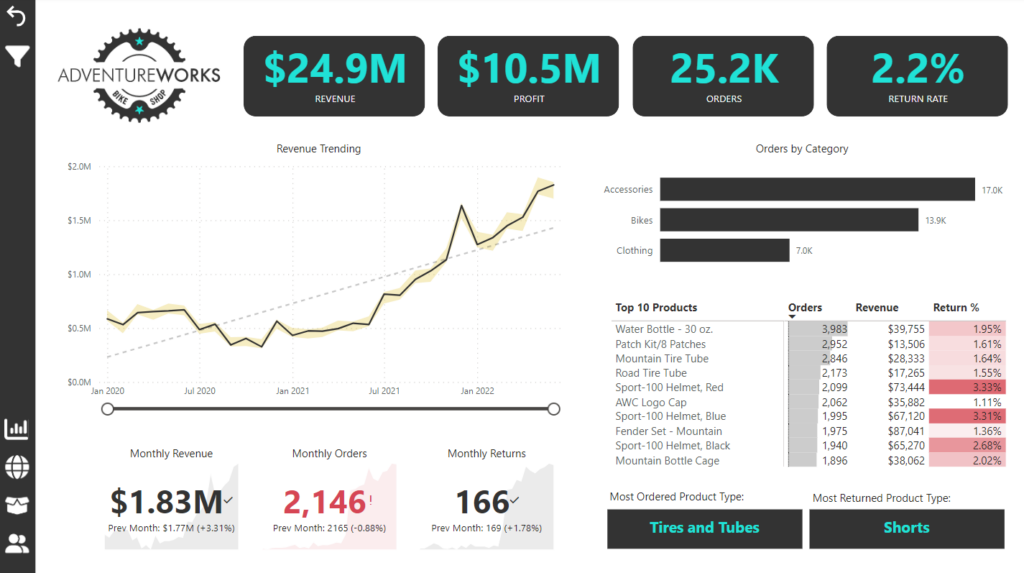
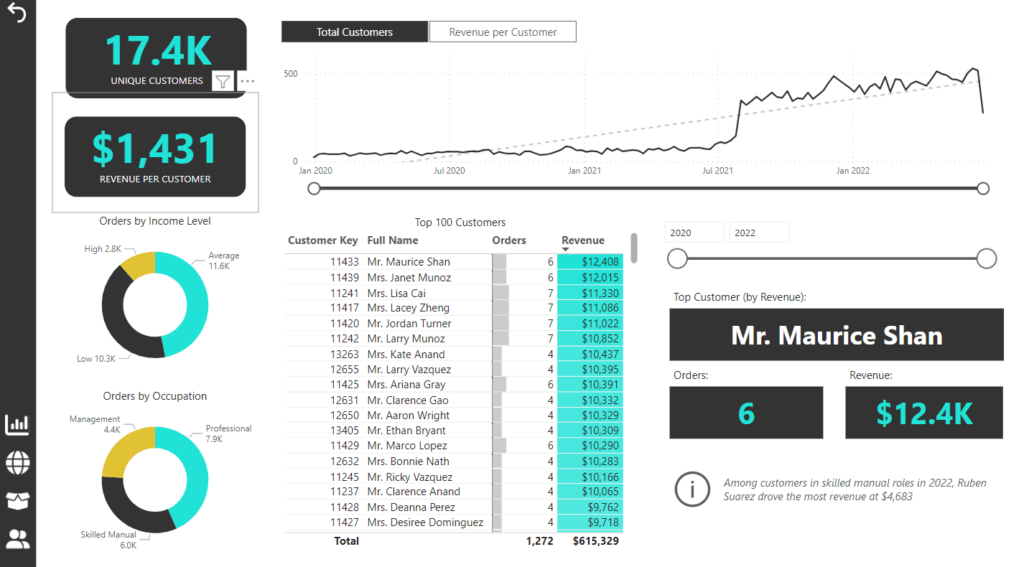
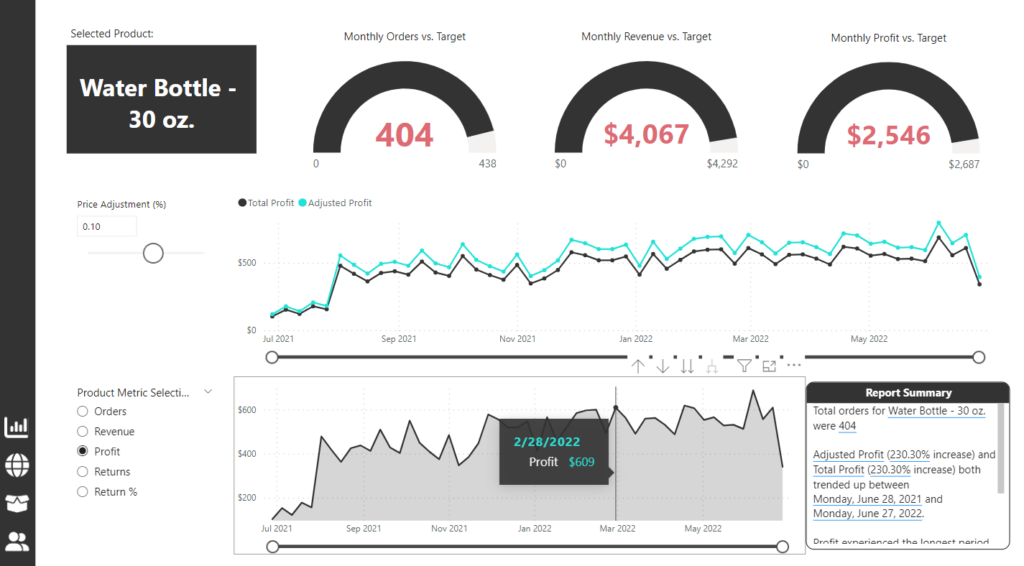
AdventureWorks (fictional) is a global manufacturing company that produces cycling equipment and accessories. The management team needs a way to track KPIs (sales, revenue, profit, returns), compare regional performance, analyze product-level trends, and identify high-value customers. The objective is to connect and transform the raw data, build a relational model, create calculated columns and measures with DAX, and design an interactive dashboard to visualize the data.
Skills Acquired
- Checking data quality and key profiling metrics like column distribution, empty values, errors, and outliers
- Transform tables using text, numerical and date/time tools, pivot and group records, and create new conditional columns
- Combining, modifying, and refreshing queries
- Creating table relationships using primary and foreign keys
- Configure report filters and trace filter context as it flows between related tables in the model
- Explore data modeling options like hierarchies, data categories, and hidden fields
- Writing DAX formula, basic operations, math, logical, text, date/time, filter, etc. function categories
- Explored tools and techniques for inserting, formatting, and filtering visuals in the Power BI Report view
- Add interactivity using tools like bookmarks, slicer panels, parameters, tooltips, and report navigation
- Configure row-level security with user roles
- Optimize reports for mobile viewing using cutom layouts