

Credits to Kirill Eremenko and SuperDataScience Team
Tableau is a powerful data visualization tool used for converting raw data into an understandable format. It helps users to create a wide variety of interactive and shareable dashboards. These visualizations can represent trends, variations, and insights through charts, graphs, and other graphics. Tableau is widely used in business intelligence for data analysis and reporting.
Skills Acquired
- Creating Custom Territories Via Groups
- Creating Custom Territories Via Geographic Roles
- Using Highlighters
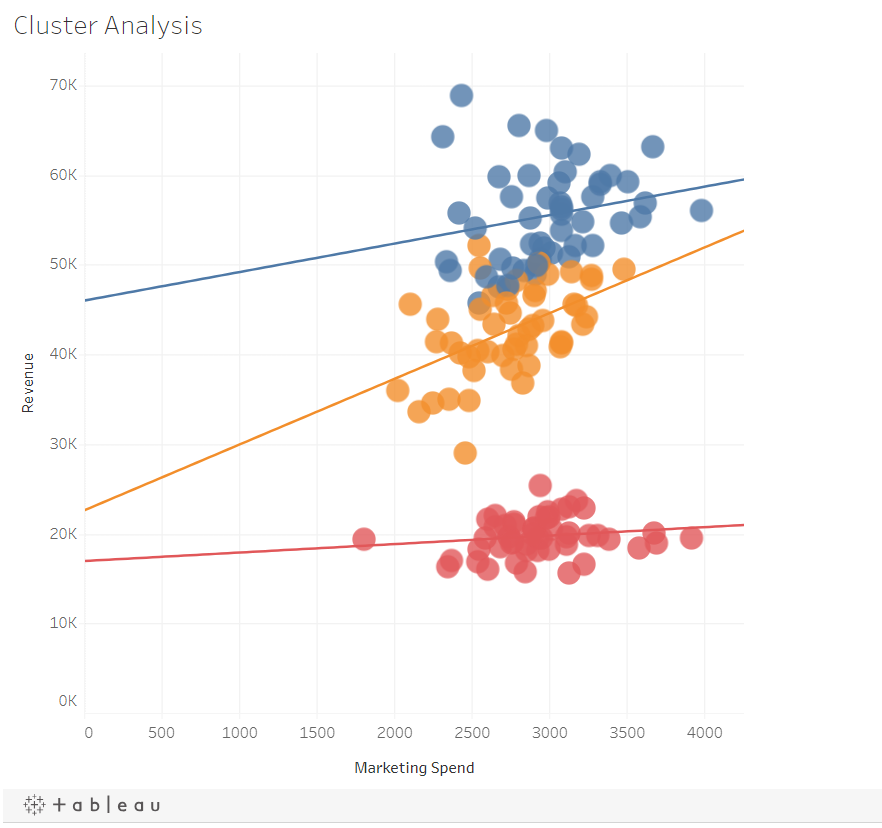
- Perform Clustering Analysis
- Using Domain Knowledge to Add External Datasets into the Analysis
- Create Cross-Database Joins
- Combine Regression Modeling with Clustering
- Save Clusters for Further Analytics
Skills Acquired
- Setting Geographical Roles
- Creating Table Calculations
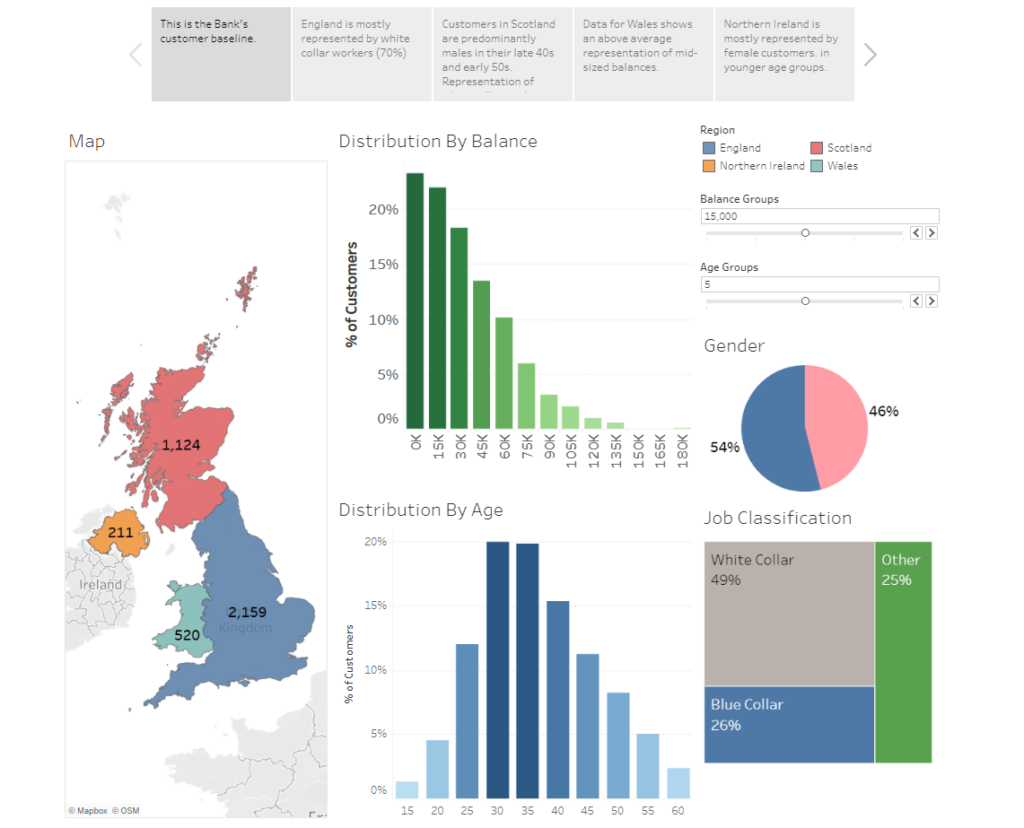
- Creating Bins and Distributions
- Leveraging the Power of Parameters
- Creating a Tree Map Chart
- Creating a Customer Segmentation Dashboard
- Advanced Dashboard Interactivity
- Analyzing Customer Segmentation Dashboard
- Creating a Storyline
Skills Acquired
- Joining data
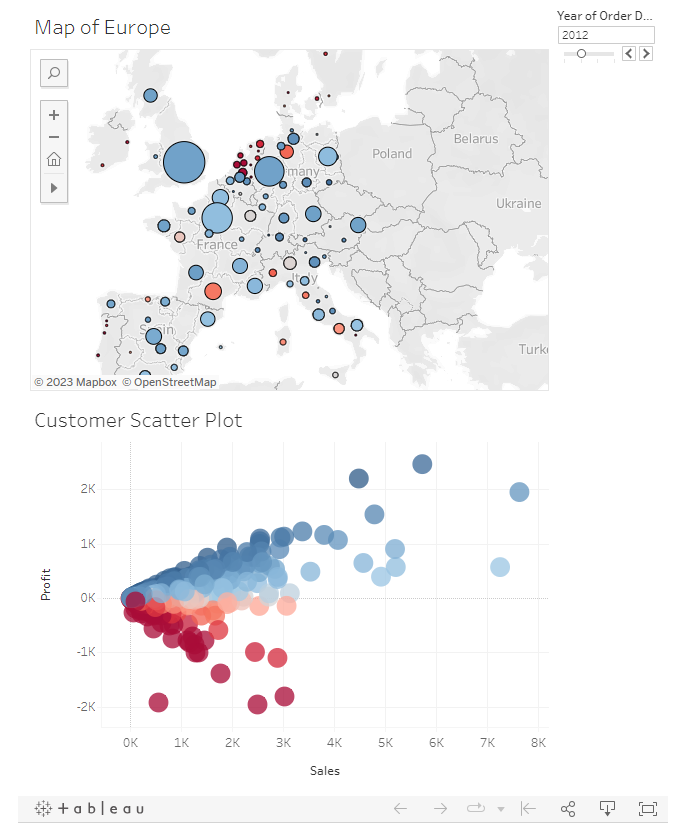
- Creating a map and working with hierarchies
- Creating a scatter plot and applying filters to multiple worksheets
- Creating dashboards
- Adding an interactive action – filter
- Adding an interactive action – highlighting